Data Visualisation for a Post-Truth World
Lisa Charlotte Rost, Stef Tervelde (DE/NL)
10.05.18 — 10:00
Bâtiment H
-> To join this or other workshops, first purchase a Mapping LAB ticket here and then register (for either a full-day or two half-day workshops) here.
An editorial data vis whizz (Bloomberg, NPR, ZEIT Online, Tagesspiegel), Lisa Charlotte Rost will provide a comprehensive data visualization primer that juxtaposes tactics, techniques, and tools used in both the newsroom and data art. Learn how to read, visualize, and plot data!
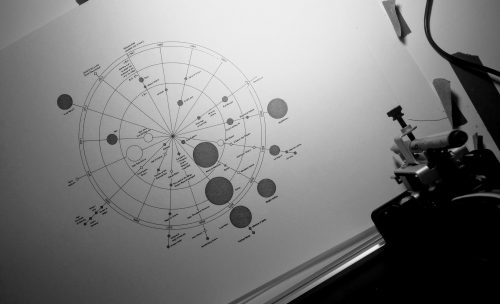
In the era of ‘alternative facts’ and ‘fake news’, the importance of understanding and properly representing data cannot be overstated. In this comprehensive data visualization primer, participants will learn how to parse and visualize data. Starting with the first principles of creating easy-to-read visualizations, we will then investigate the tools and techniques by which newsrooms create everything from simple charts to mind-bending interactive experiences and learn how to create a newsroom visualisation of our own. Then, newsroom standards are thrown overboard in favour of generating meaningful data art – which we will then plot on paper. In order to do so, participants will learn how control an AxiDraw plotter with a custom Processing sketch.
Workshop duration: half-day
Workshop language: English
Number of participants: 12 max.
Requirements: a computer, preferably with Processing and Inkscape installed / no coding skills required (workshop includes a Processing crash-course).
About Lisa Charlotte Rost and Stef Tervelde: Lisa Charlotte Rost is a data-affine designer who loves systems, maps, and overviews. Before starting to work for Datawrapper (a charting tool for journalists), she visualized data in the graphics teams of Bloomberg in New York City, NPR in Washington DC, and ZEIT Online and Tagesspiegel in Berlin. Lisa taught data visualization at several German universities and lives in Berlin, where she co-organizes the monthly Data Vis Meetup.
Stef Tervelde is a graduate of Interaction Design at ArtEZ Academy of Art Arnhem with a passion for all things digital. He uses code to design processes for quick iteration and design as a tool to look critically at the technologies that he creates. He is currently part of the team at NEEEU.